To help Analytics: write your to automatically upload reports Yandex.Metrics with AWS for free
our practice analyst I often have to face situations when colleagues spend a lot of time on tedious unloading of data for regular reporting. If Google Analytics and other Google products written many plug-ins, tools and add-ins for Excel, to Yandex Metrics, and other analytical systems have managed to find only a couple of libraries 2013.
When working with advertising systems such as Adfox, the situation is no less "heavy". Numerous discharge manually can, over time, depressed, anyone, absolutely leaving no time for the useful part of this activity: analysis and conclusions based on these data. Sometimes the solution is recourse to the developers that can help with setting up and unloading the required data. In practice, however, the reporting requirements change frequently, and constantly having to pull developers will not work.
In this and following articles I will show how to use Amazon Web Services just set up automatic export of data. On AWS is possible within 12 months to use the free account limits which is described in algorithm. You can choose any other service rent computing power, however, is not free, I have never met. In addition to the instances on AWS already have Python with the required libraries.
As an example, counter data will use your website. The result of this article will be a small script for a set of counters unloads visits per day for the dates indicated. On the basis of it already, you can quickly navigate to the uploads. The disadvantage of this method include the need for the first time to spend about an hour setting account and habituation to the interface. But in the subsequent calls of this procedure to take place is not necessary. You simply start the instance and ready in a few minutes, get the necessary data.
So, let's begin. Register an account on Amazon Web Services console.aws.amazon.com and customizable access management console. Unfortunately after creating your account to use AWS you need to wait a day until it is proven your card. In this article, it will not be charged (we won't go beyond the free usage limits). The registration process is well described in the AWS documentation (to the point of Getting started) docs.aws.amazon.com/AWSEC2/latest/UserGuide/ec2-ug.pdf
After successful verification of the card (will mail notification of the completion of the process) console console.aws.amazon.com should look like this:
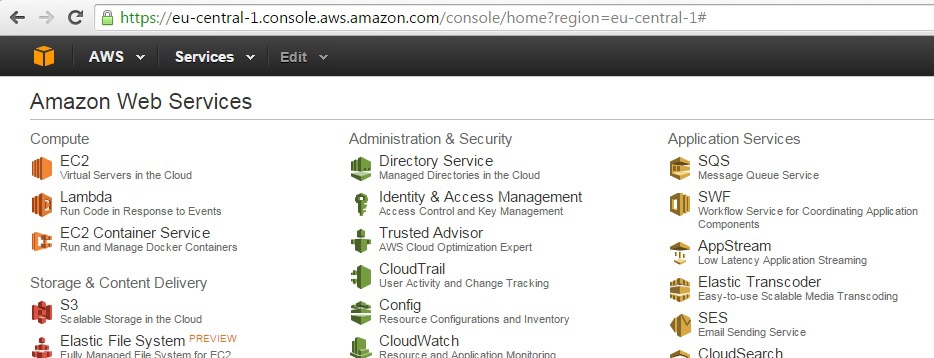
Go to the EC2 and in the left pane, select Instances. Click Launch Instance:
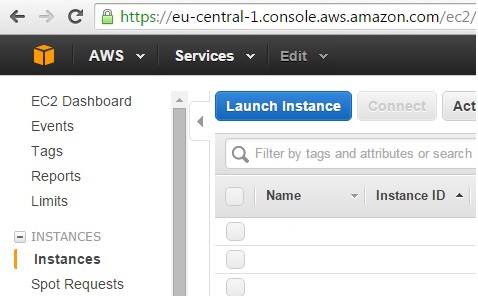
We offer a choice of a variety of operating systems. In this example, the choice of operating system is not important. I'm used to Ubuntu (the fourth line in the screenshot). You can select the first line of Amazon Linux. The difference from the example is that by default on the Amazon Linux the user login when entering the machine ec2-user. For Ubuntu ubuntu login:

The next step is to select the type of path. For free use choose the first option, t2.micro. Prices for other options, see aws.amazon.com/ru/ec2/pricing:

On the last seventh step, check the security group field Security Groups (SSH access must be enabled for port 22 for at least your IP address) and press Launch. Go back to the list of instances that waiting for our running instance, the Instance State will not be running (it will take a couple of minutes). Select the line with our instance and are looking for Public DNS. Copy the Public DNS and go to the car. For Windows easier to use Putty, MAC Terminal. The documentation for the create account process is described for Windows and MAC. Just in case once again for Putty. Ubuntu login, port 22

Do not forget to Connection -- > SSH -- > Auth to specify the path to the private key (with extension *.ppk):

Go to the car, the warning Windows "The server's host key is not cached in the registry" click "Yes." If all goes well, we get the following:

Check if everything is fine with Python (default on AWS it is already installed): type in console "python" and press Enter. After entering the Python console typed 1+1 and again press Enter. To exit the Python console, press Ctrl+D:

The last step to load data from Yandex Metrics will be the authorization token is:
1. Go to page create applications Yandex oauth.yandex.ru/client/new
2. Call and its application in the field of Law for Yandex Metric, select "get statistics, read their parameters and proxy counters":

See the full list of apps and their ID can be viewed at the registered apps oauth.yandex.ru (in the example, the application named "Weekly report"):

To obtain the token, we need ID. Substitute this value in the link of obtaining a debugging token in the browser in the last parameter client_id: oauth.yandex.ru/authorize?response_type=token&client_id=04d488...87aacb
The result of the authorization token 11daf5...516d that can be used in every request to Yandex Metrica:

We finished the long process of preparing the technical side. Next time you need to pass. Now let's create the first "Hello world" to our data in Yandex Metric. To edit the scripts on the instance you can use a variety of connecting and editors, or just work in the console. In Windows for simple scripts you can use WinSCP (https://winscp.net/eng/docs/lang:ru) and a built-in Notepad.
After connecting to the instance (in the same way as is done in Putty), we are in the folder /home/ubuntu. Make a separate folder 'yam' (using F7) and create a file 'test.py (Shift+F4). Now check that everything works by unloading the data in the report "Attendance" yesterday according to the documentation of API Yandex Metrics tech.yandex.ru/metrika/doc/api2/api_v1/intro-docpage:

Import the library 'requests' and 'json' for API requests and JSON format. In the variable atoken in quotes indicate a previously obtained authorization token. Copy this code into the file 'test.py' and save:
the
Parameter 'id' of the line r=requests.get (...), you must specify the counter number at which to take data. It can be found in the counter list (https://metrika.yandex.ru/list) next to the name. Setting accuracy corresponds to the slider "Accuracy" in the web interface, date1 and date2 — the period of discharge, metrics — metrics (columns). Still have the measurements (dimensions), they will be useful later. Yandex Metrica provides ready-made templates, you can substitute them into a query string tech.yandex.ru/metrika/doc/api2/api_v1/presets/preset_traffic-docpage
json.loads converts from Yandex Metrics response JSON to array, from which you can easily select the desired elements (in this case, the number of visits for yesterday). Line print json.dumps(...) will show us the API response in a more human form.
Run the script in Putty or terminal, typed 'python test.py'. Success:

To reach the number 489 of this array (i.e., in Python it's "dictionary") go through its hierarchical structure from the top down:
1. The first level of the hierarchy is the element 'data' is the first in circulation: ['data']
2. Then there is a square bracket, then starts the list. In our case, this is a list of one element, then we put [0]
3. Next come the two elements 'dimensions' and 'metrics'. Select ['metrics']
3. Finally, in the 'metrics' sheet again with one element
Thus the address of the number of visits 489.0 yesterday is ['data'][0]['metrics'][0]. Add in our script a line:
print parsed['data'][0]['metrics'][0]
As a result of repeated start at the end displays the number of visits for yesterday.
OK, 'hello world' is fun. Download now something more practical. For example, visits by last week for a list of sites and write it to a file. Then I will write to the file on days of visits to the same site over the past week:
the
Now the response will resemble the following:

Now we need a loop to go through all the dates and get the number of visits for each day. From the structure it is evident that it is necessary to walk on the sheet in parser['data']. Let's see what is each element of this list. For this, we add to the end of the script cycle:
the
Those unfamiliar with Python note the indentation in front of 'print day' (tab or multiple spaces). This indentation defines the beginning and the end of the cycle. Run:

Now more clear how to get the date and number of visits. Instead of 'print day' put:
the

Add ability to upload data for multiple projects and write all to a file, replacing the visits of a point on the commas. So when exporting to Excel didn't have to do that. In the example in the sheet listOfSites you can substitute any number of counters projects, here is two of the same just for example. File 'weekly_data.txt' will be overwritten each time the script is run:
the
Total after launch we should have a file 'weekly_data.txt' visits by days listed in listOfSites sites (in our example the numbers are repeated twice), which can be easily copied into Excel. Or any other instrument in which you are reporting:

After completion go to the AWS management console and on our instance using the right mouse button, select Instance state — Stop. Next time will not have to go through a long setup procedure. Just select the Instance state Start and a few minutes from start working with the code:

Using this simple approach and documentation for the Yandex Metrics you can configure almost any discharge. I hope this tutorial will save you a lot of time and effort while uploading the data.
Article based on information from habrahabr.ru
When working with advertising systems such as Adfox, the situation is no less "heavy". Numerous discharge manually can, over time, depressed, anyone, absolutely leaving no time for the useful part of this activity: analysis and conclusions based on these data. Sometimes the solution is recourse to the developers that can help with setting up and unloading the required data. In practice, however, the reporting requirements change frequently, and constantly having to pull developers will not work.
In this and following articles I will show how to use Amazon Web Services just set up automatic export of data. On AWS is possible within 12 months to use the free account limits which is described in algorithm. You can choose any other service rent computing power, however, is not free, I have never met. In addition to the instances on AWS already have Python with the required libraries.
As an example, counter data will use your website. The result of this article will be a small script for a set of counters unloads visits per day for the dates indicated. On the basis of it already, you can quickly navigate to the uploads. The disadvantage of this method include the need for the first time to spend about an hour setting account and habituation to the interface. But in the subsequent calls of this procedure to take place is not necessary. You simply start the instance and ready in a few minutes, get the necessary data.
So, let's begin. Register an account on Amazon Web Services console.aws.amazon.com and customizable access management console. Unfortunately after creating your account to use AWS you need to wait a day until it is proven your card. In this article, it will not be charged (we won't go beyond the free usage limits). The registration process is well described in the AWS documentation (to the point of Getting started) docs.aws.amazon.com/AWSEC2/latest/UserGuide/ec2-ug.pdf
After successful verification of the card (will mail notification of the completion of the process) console console.aws.amazon.com should look like this:
Go to the EC2 and in the left pane, select Instances. Click Launch Instance:
We offer a choice of a variety of operating systems. In this example, the choice of operating system is not important. I'm used to Ubuntu (the fourth line in the screenshot). You can select the first line of Amazon Linux. The difference from the example is that by default on the Amazon Linux the user login when entering the machine ec2-user. For Ubuntu ubuntu login:
The next step is to select the type of path. For free use choose the first option, t2.micro. Prices for other options, see aws.amazon.com/ru/ec2/pricing:
On the last seventh step, check the security group field Security Groups (SSH access must be enabled for port 22 for at least your IP address) and press Launch. Go back to the list of instances that waiting for our running instance, the Instance State will not be running (it will take a couple of minutes). Select the line with our instance and are looking for Public DNS. Copy the Public DNS and go to the car. For Windows easier to use Putty, MAC Terminal. The documentation for the create account process is described for Windows and MAC. Just in case once again for Putty. Ubuntu login, port 22
Do not forget to Connection -- > SSH -- > Auth to specify the path to the private key (with extension *.ppk):
Go to the car, the warning Windows "The server's host key is not cached in the registry" click "Yes." If all goes well, we get the following:
Check if everything is fine with Python (default on AWS it is already installed): type in console "python" and press Enter. After entering the Python console typed 1+1 and again press Enter. To exit the Python console, press Ctrl+D:
The last step to load data from Yandex Metrics will be the authorization token is:
1. Go to page create applications Yandex oauth.yandex.ru/client/new
2. Call and its application in the field of Law for Yandex Metric, select "get statistics, read their parameters and proxy counters":
See the full list of apps and their ID can be viewed at the registered apps oauth.yandex.ru (in the example, the application named "Weekly report"):
To obtain the token, we need ID. Substitute this value in the link of obtaining a debugging token in the browser in the last parameter client_id: oauth.yandex.ru/authorize?response_type=token&client_id=04d488...87aacb
The result of the authorization token 11daf5...516d that can be used in every request to Yandex Metrica:
We finished the long process of preparing the technical side. Next time you need to pass. Now let's create the first "Hello world" to our data in Yandex Metric. To edit the scripts on the instance you can use a variety of connecting and editors, or just work in the console. In Windows for simple scripts you can use WinSCP (https://winscp.net/eng/docs/lang:ru) and a built-in Notepad.
After connecting to the instance (in the same way as is done in Putty), we are in the folder /home/ubuntu. Make a separate folder 'yam' (using F7) and create a file 'test.py (Shift+F4). Now check that everything works by unloading the data in the report "Attendance" yesterday according to the documentation of API Yandex Metrics tech.yandex.ru/metrika/doc/api2/api_v1/intro-docpage:
Import the library 'requests' and 'json' for API requests and JSON format. In the variable atoken in quotes indicate a previously obtained authorization token. Copy this code into the file 'test.py' and save:
the
import requests
import json

atoken = 'insert token here'

r = requests.get('https://api-metrika.yandex.ru/stat/v1/data?&id=21075004&accuracy=full&date1=yesterday&date2=yesterday&metrics=ym:s:visits&oauth_token=' + atoken)

parsed = json.loads(r.text)
print json.dumps(parsed, indent=4, sort_keys=True)
Parameter 'id' of the line r=requests.get (...), you must specify the counter number at which to take data. It can be found in the counter list (https://metrika.yandex.ru/list) next to the name. Setting accuracy corresponds to the slider "Accuracy" in the web interface, date1 and date2 — the period of discharge, metrics — metrics (columns). Still have the measurements (dimensions), they will be useful later. Yandex Metrica provides ready-made templates, you can substitute them into a query string tech.yandex.ru/metrika/doc/api2/api_v1/presets/preset_traffic-docpage
json.loads converts from Yandex Metrics response JSON to array, from which you can easily select the desired elements (in this case, the number of visits for yesterday). Line print json.dumps(...) will show us the API response in a more human form.
Run the script in Putty or terminal, typed 'python test.py'. Success:
To reach the number 489 of this array (i.e., in Python it's "dictionary") go through its hierarchical structure from the top down:
1. The first level of the hierarchy is the element 'data' is the first in circulation: ['data']
2. Then there is a square bracket, then starts the list. In our case, this is a list of one element, then we put [0]
3. Next come the two elements 'dimensions' and 'metrics'. Select ['metrics']
3. Finally, in the 'metrics' sheet again with one element
Thus the address of the number of visits 489.0 yesterday is ['data'][0]['metrics'][0]. Add in our script a line:
print parsed['data'][0]['metrics'][0]
As a result of repeated start at the end displays the number of visits for yesterday.
OK, 'hello world' is fun. Download now something more practical. For example, visits by last week for a list of sites and write it to a file. Then I will write to the file on days of visits to the same site over the past week:
the
import requests
import json

atoken = "

r = requests.get('https://api-metrika.yandex.ru/stat/v1/data?&id=21075004&accuracy=full&date1=2015-08-10&date2=2015-08-16&group=day&dimensions=ym:s:date&metrics=ym:s:visits&sort=ym:s:date&oauth_token=' + atoken)

parsed = json.loads(r.text)
print json.dumps(parsed, indent=4, sort_keys=True)
Now the response will resemble the following:
Now we need a loop to go through all the dates and get the number of visits for each day. From the structure it is evident that it is necessary to walk on the sheet in parser['data']. Let's see what is each element of this list. For this, we add to the end of the script cycle:
the
for day in parsed['data']:
print day
Those unfamiliar with Python note the indentation in front of 'print day' (tab or multiple spaces). This indentation defines the beginning and the end of the cycle. Run:
Now more clear how to get the date and number of visits. Instead of 'print day' put:
the
print str(day['dimensions'][0]['name']) + '\t' + str(day['metrics'][0])
Add ability to upload data for multiple projects and write all to a file, replacing the visits of a point on the commas. So when exporting to Excel didn't have to do that. In the example in the sheet listOfSites you can substitute any number of counters projects, here is two of the same just for example. File 'weekly_data.txt' will be overwritten each time the script is run:
the
import requests
import json

listOfSites = ['21075004', '21075004']
f = open('weekly_data.txt', 'w')

atoken = "

for site in listOfSites:
r = requests.get('https://api-metrika.yandex.ru/stat/v1/data?&id=' + site + '&accuracy=full&date1=2015-08-10&date2=2015-08-16&group=day&dimensions=ym:s:date&metrics=ym:s:visits&sort=ym:s:date&oauth_token=' + atoken)

parsed = json.loads(r.text)
print json.dumps(parsed, indent=4, sort_keys=True)

for day in parsed['data']:
print str(day['dimensions'][0]['name']) + '\t' + str(day['metrics'][0])
f.write(str(day['dimensions'][0]['name']) + '\t' + str(day['metrics'][0]).replace('.', ',') + '\n')

f.close()
Total after launch we should have a file 'weekly_data.txt' visits by days listed in listOfSites sites (in our example the numbers are repeated twice), which can be easily copied into Excel. Or any other instrument in which you are reporting:
After completion go to the AWS management console and on our instance using the right mouse button, select Instance state — Stop. Next time will not have to go through a long setup procedure. Just select the Instance state Start and a few minutes from start working with the code:
Using this simple approach and documentation for the Yandex Metrics you can configure almost any discharge. I hope this tutorial will save you a lot of time and effort while uploading the data.


Комментарии
Отправить комментарий